TL;DR
This app is cool, download it and play with it just by singing into your phone, or playing some music in your room!
Musical background
We perceive sound through changes in the air pressure. When air pressure vibrates with a constant rhythm we call it a pitch. The speed of vibrations is measured throught frequency, which quantifies how many vibrations happen per second (Hertz). The faster the air pressure vibrates, the higher is the frequency, and the higher the pitch we hear. Human ear can perceive frequencies roughly between 20 and 20,000 Hertz. The lowest frequency sounds we can hear with vibrate 20 times per second. The highest frequency sounds we can hear with vibrate 20,000 times per second. There is an infinite continuum of frequencies between 20 and 20,000 Hertz... In music, we select a finite number of frequencies from this continuum and call them notes. Which specific frequencies we select determines the scale in which the music is composed.
Many musical scales have existed throughout the history of music. The scales are designed in such a way that the combinations of nearby notes sound good together. This is not easy to achieve, as the notes that sound good together need to have a specific frequency ratio between them, such as 2/1, 3/2, 4/3, etc. But composing music also needs regularity, such that the relationships between frequencies of notes are preserved throughout the scale from the lowest to highest notes, while at the same time preserving a similar repeatable structure in each octave (doubling of frequency), so that the music can easily be played in lower to higher notes. This is a very difficult problem if you want to preserve perfect frequency ratios between notes, while at the same time having repeated structure through octaves. Long story short, the modern Western music has converged on so-called chromatic scale, where every note has a frequency which is 1.059463 of the frequency of the note below it. All the notes are equally spaced from each other in logarithmic space of frequencies, and there are exactly 12 notes per octave. These notes do not have perfect frequency ratios of 3/2, 4/3, etc between each other, but they are "close enough" so that our ear can accept them as "ah ok, this will do just fine" (though not all people agree). In exchange for sacrificing the perfect frequency ratios, the chromatic scale provides us with a nice structure of exactly 12 notes per octave, so that the music can easily be played in higher or lower notes. Note that when the modern music is composed, we usually select a subset of 7 out of the 12 notes in each octave and use only them, otherwise it's "just too much" for our brain to process music as a consistent melody. These scales further break down into various minor and major scales.
Configure sound input
Wiggles Like app detects 120 notes in chromatic scale (12 notes in each octave, over 10 octaves), starting from the highest frequency that is supported by the input sound you put in. The highest frequency that can be detected from digital sound is determined from the sample rate of the sound, and equals 1/2 of the sample rate. For example, if you feed the sound at the sample rate of 44,100, the highest frequency that will be detected is 22,050. The input sample rate can be selected using the "Input" icon from the toolbar:
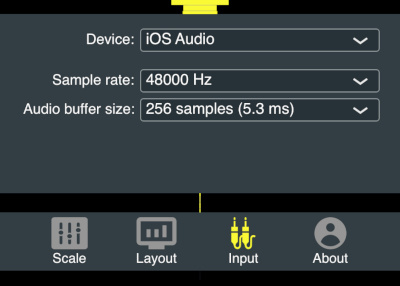
Most of the people will use the input from the microphone. But if you have an input audio device attached, you can select to feed the sound from it into the app. To make the app react facter to sounds, select the shortest Audio buffer size available. This will not affect performance of the app, as it can handle the sound in real-time, even if the buffer size was just one audio sample.
Visualisations available
Wiggles Like app can display the amplitudes of the notes it detects in various layouts. Some of the layouts help perceiving the related notes better than a simple linear layout, because they display the notes that are octave apart next to each other (more on this below).
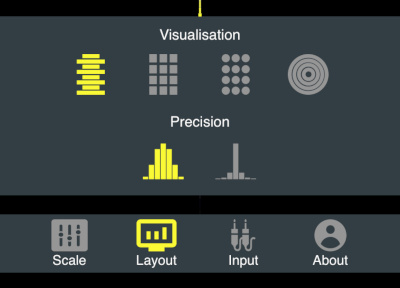
You can use "Layout" icon from the toolbar to select the preferred visualisation:
Linear visualisation (#1)
Displays the amplitides on notes arranged linearly in a vertical line, with higher notes displayed higher on the scale. This visualisation is similar to typical frequency visualisation applications. Note that Wiggles Like app uses a novel frequency detection algorithm that does not have the typical noise in the low frequencies generated by Fourier transform using short sound windows for detection:
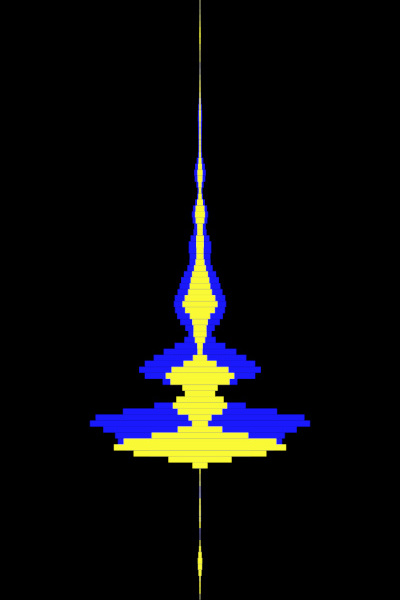
The yellow meters show the current amplitude of each detected note, whereas the blue meters show the averaged "trace" amplitude over a recent period of time. This helps to see if a particular pitch is moving up or down (for example, if you sing into the microphone). Check out this Instagram post that I made during development:
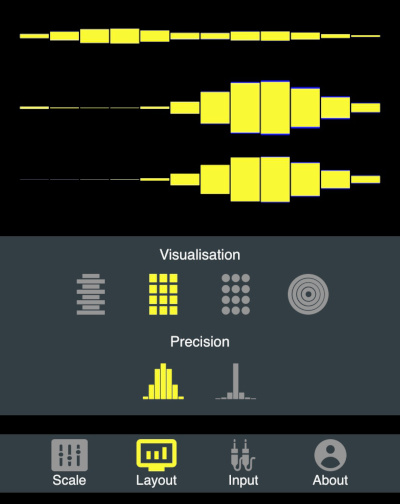
Rectangles visualisation (#2)
Arranges all detected notes into 10 rows of 12 notes each, with every row comprising one octave:
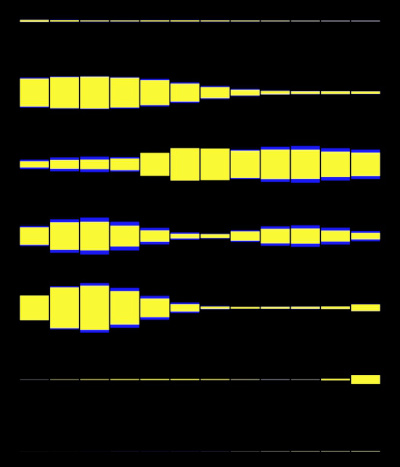
Each rectangle's height corresponds to the amplitude of the detected note. Looking at a visualisation like this helps to see if two notes that are octave apart are played at the same time. This is typical of almost all instruments, as well as human voice. In the example above, I was just singing "mmmmm" into the microphone. Check out how the notes align in the following visualisation:
Bubbles visualisation (#3)
Similar to the rectangles visualisation, with the ony difference that it displays circles instead of rectangles. The radius of the displayed circles is proportional to the amplitude of the detected notes:
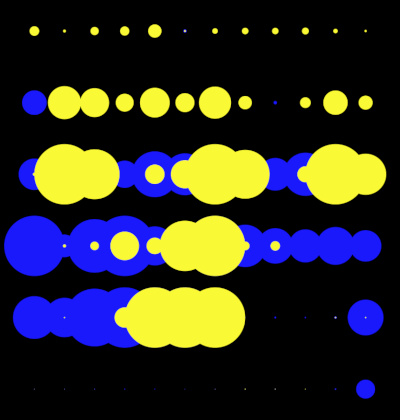
Above, I was also singing "mmmmm" into the microphone, but I tried to got from lower to higher pitch, and so you see the blue "tracers" to the left of the big bubbles. It's more fun when you try to do it yourself, and see the display in real time. Here is an Instagram post demonstraing the visualisation (with slightly exaggerated sizes, I'll explain how to do it below):
Circle visualisation (#4)
This the one I like the most when I am listening to rhythmic music. It arranges the notes in octaves (12 notes) going around the circle, kinda like a clock. The lowest notes are in the centre of the display:
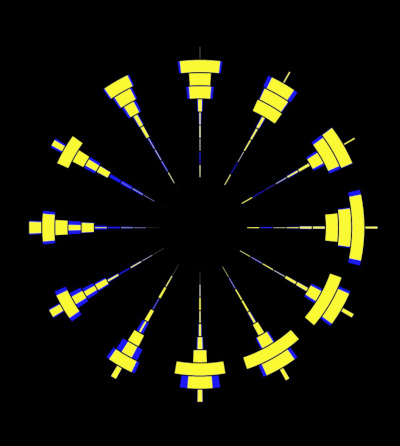
Above, I just said "tsss" into the microphone, so you mainly see the high frequencies (on the outside) being activated. It's much more fun to watch this in real time. Check out this Instagram post:
High-precision note detection
You might have noticed the "Precision" option in the "Layout" settings. There are two icons indicating low and high precision note detection. Below you can see two screenshots with this feature, while I am trying to sing the same note into the microphone.
High-precision off:
High-precision on:
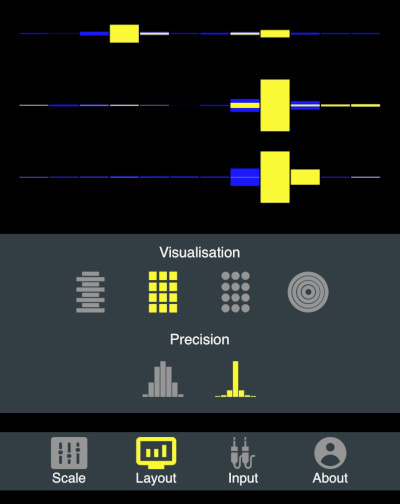
The effect on the first picture (with low precision) is called "frequency leakage". It basically means that, given a finite sample of discrete audio samples, it is "impossible" to detect a frequency exactly using Fast Fourier Transform (unless the frequency coinsides exactly with a frequency that FFT can detect exactly). However, Wiggles Like app comes with a novel high-precision frequency detection algorithm that enables it to overcome the limitations of Fast Fourier Transform.
Linear visualisation is best viewed with high-precision: off, because the frequency peaks can more easily be identified by our eye when they are wider.
Configure zoom
Zoom is necessary to control the size of the visualisation elements, to adjust for the volume of the input sound (we don't call it "volume" or "scale" as not to confuse with the actual volume of sound or with musical scales).
Click the "Zoom" button on the main toolbar to view zoom options:
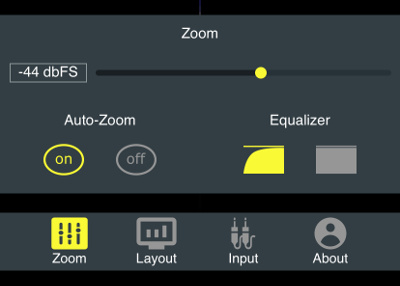
By default, Auto-Zoom is turned on, which means that the zoom will adjust depending on the volume of the input sound. However, you can turn Auto-Zoom off, and then set the desired zoom manually.
Equalizer option is necessary to adjust for human perception of the volume of different frequencies. By default it de-emphacises low frequencies, because our ear is less sensitive to them. We roughly used ISO-226 standard for the curve in the lower frequencies, however the frequencies above 800 Hz have a flat curve, as opposed to ISO-226.
You can disable the equalizer by choosing the second "flat" option. This will result in you seeing the sizes of elements proportional to actual amplitudes of frequencies. This might be useful to mastering sound, but you won't be able to see much detail in the higher frequencies.